Manage your disputes in real time!
Identifying and dealing with disputes is a good business practice and essential to preserve customer satisfaction and cash flow. However, what if more and more disputes are generated by deficiencies in your company's sales process?
Recurring administrative disputes, too frequent quality or delivery problems, etc. Different causes can always produce the same effects.
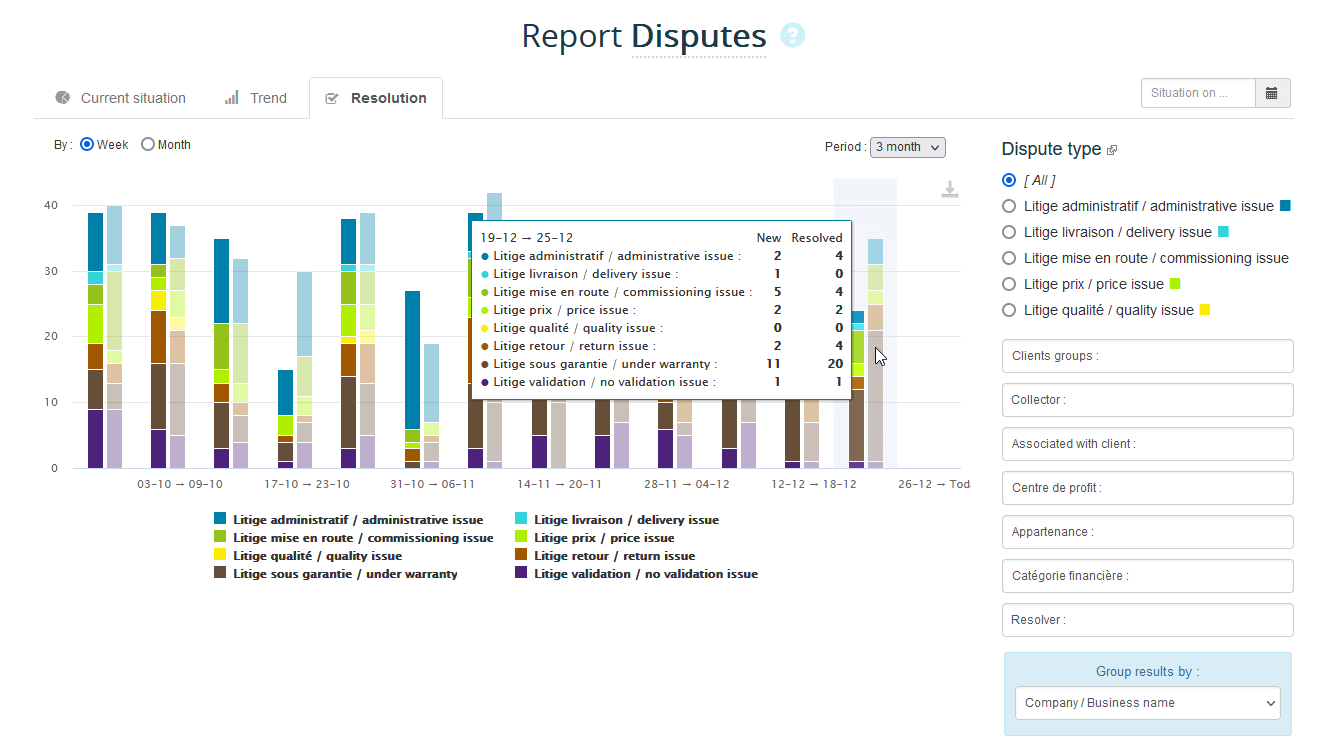
The "Resolution" dispute report highlights by period (week or month) the number and type of new disputes versus those that have been resolved.

This allows two things:
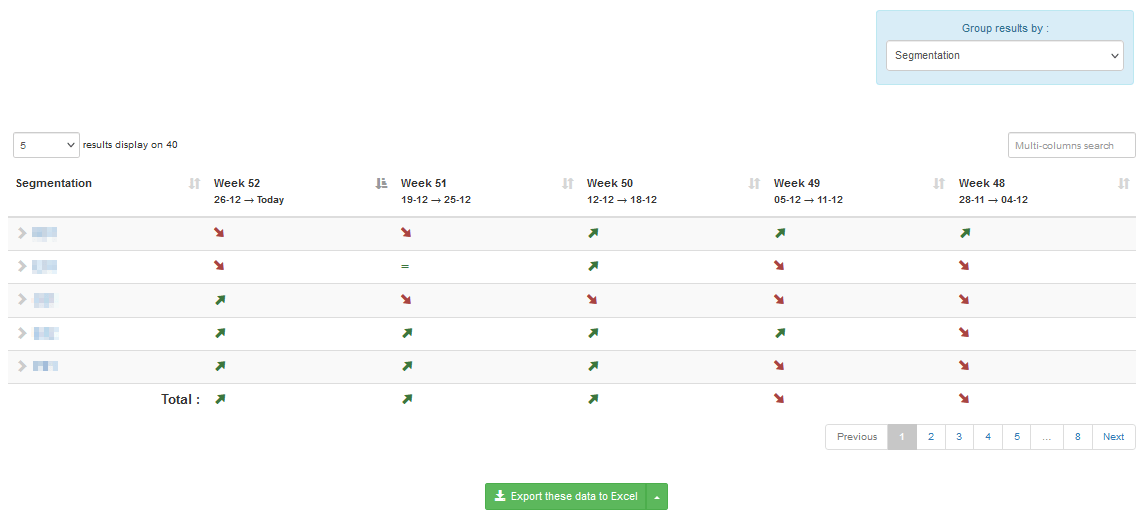
Below the graph, the table allows you to refine the analysis by viewing by customer, portfolio or customer segmentation the trend concerning the number of disputes in progress, taking into account new ones and those resolved over the period.

Recurring administrative disputes, too frequent quality or delivery problems, etc. Different causes can always produce the same effects.
The "Resolution" dispute report highlights by period (week or month) the number and type of new disputes versus those that have been resolved.

This allows two things:
- Identify the typology of new disputes, with the aim of dealing with the root of the problem. For example, correcting a recurring quality problem that systematically generates customer dissatisfaction and unpaid invoices.
- Visually ensure that the momentum is good, i.e. more disputes are resolved rather than created.
Below the graph, the table allows you to refine the analysis by viewing by customer, portfolio or customer segmentation the trend concerning the number of disputes in progress, taking into account new ones and those resolved over the period.
